PHP-FPM Monitoring
With OpsDash, you can easily monitor PHP FastCGI Process Manager (FPM) daemons via their /status URI. You can also monitor clusters of FPM nodes and aggregate results across all of them. For example, you can have a single graph that shows the slow requests per second over a cluster of nodes that run FPM processes.
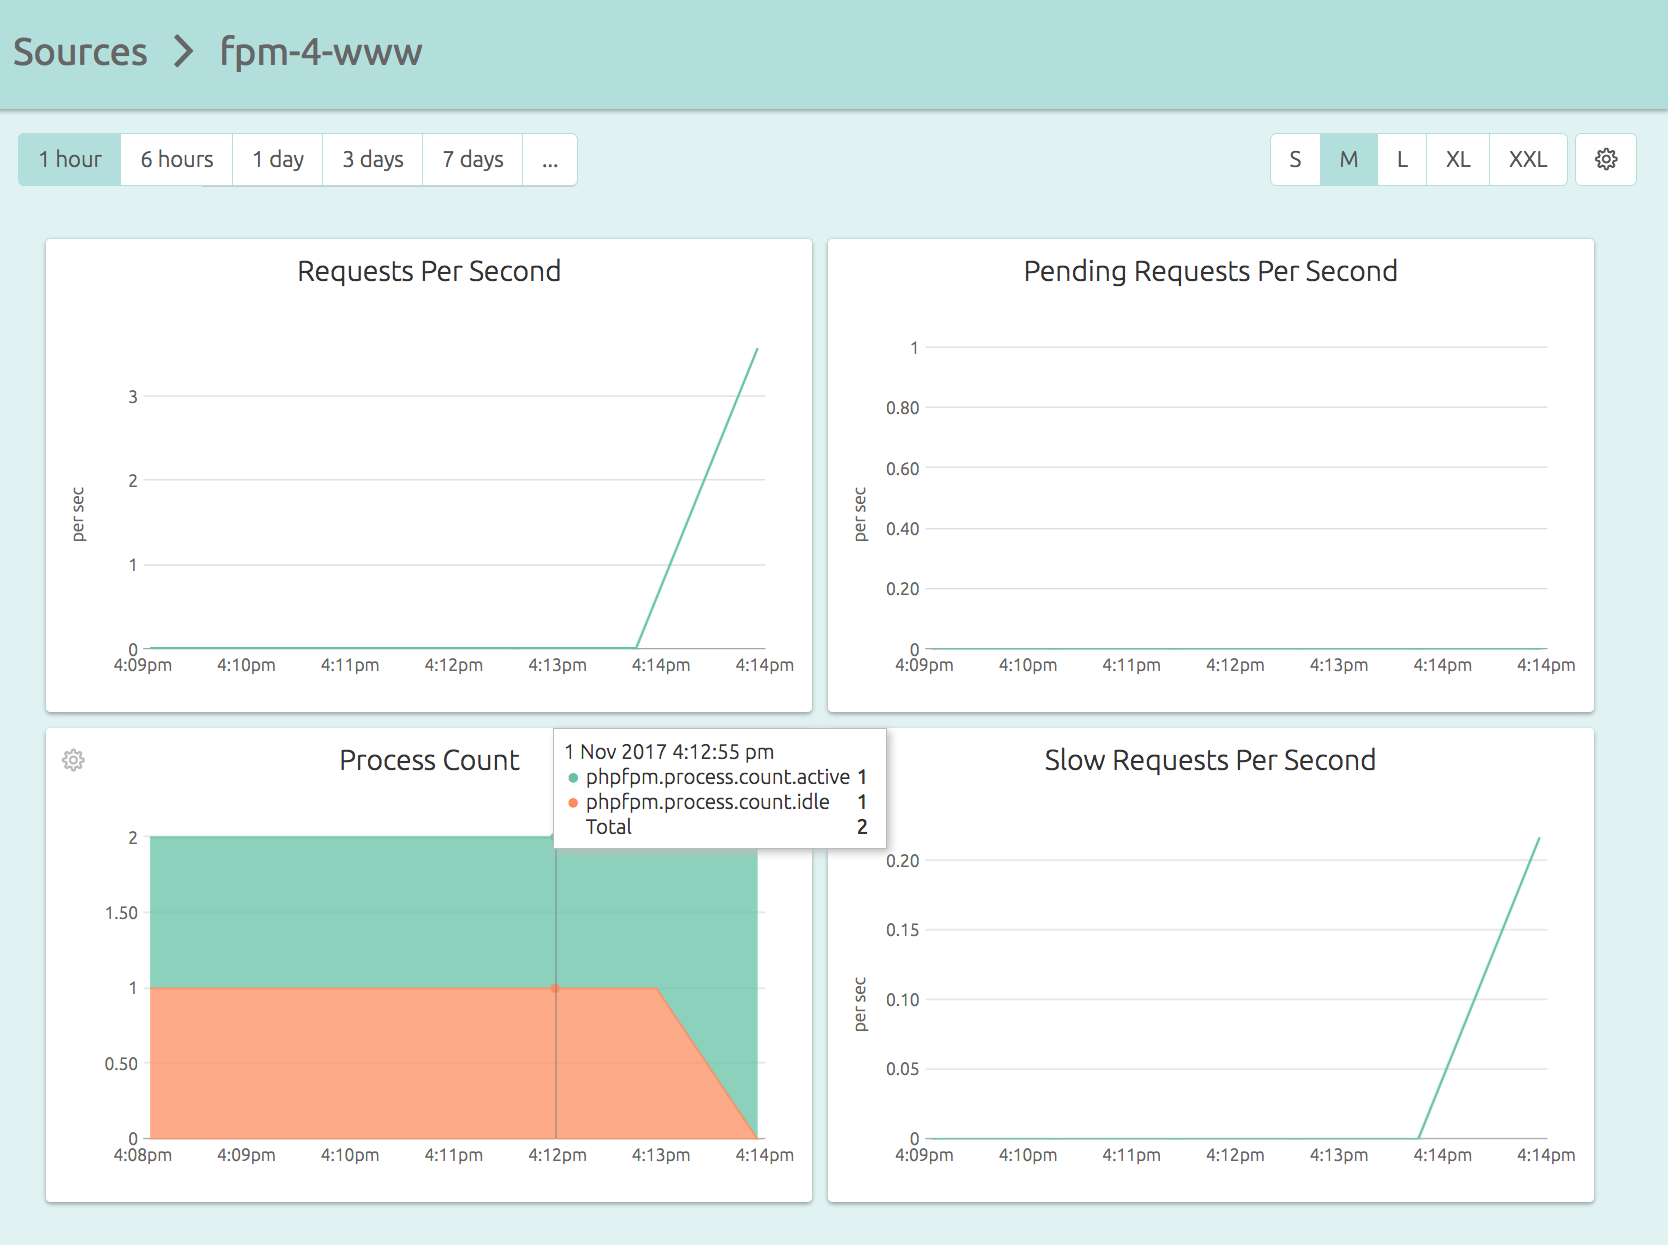
Here’s how OpsDash’s curated dashboards come out of the box:
You can go from 0 to this in just a minute or two! OpsDash strives to save you the tedious work of setting up a useful dashboard.
This dashboard shows key metrics relevant to the PHP FPM instance’s health and performance:
- Requests Per Second: The rate of requests being processed.
- Pending Requests Per Second: The rate of requests pending to be processed.
- Process Count: The total number of active and idle FPM processes.
- Slow Requests Per Second: The rate of requests each second that exceed the slow limt (set by the configuration option "request_slowlog_timeout"). This metric may not be available in older version of FPM.
You’ll want to set warning and critical upper limits for these metrics so that you can identify and address emerging issues before they bite. You can quickly setup your alerts in OpsDash and send notifications by Slack, Hipchat, OpsGenie, VictorOps PagerDuty or Email.
With OpsDash, PHP FPM monitoring is fast and easy. Try it!
New here?
OpsDash is a comprehensive solution for server monitoring, service monitoring, database monitoring and application metrics monitoring. You can use OpsDash for monitoring MySQL, PostgreSQL, MongoDB, memcache, Redis, Apache, Nginx, Elasticsearch and more. It provides intelligent, customizable dashboards and spam-free alerting via email, HipChat, Slack, PagerDuty, OpsGenie, VictorOps and Webhooks. Send in your custom metrics with StatsD and Graphite interfaces built into each agent.